
Quick Service Restaurant Market Growth: Digital Innovation and Sustainability Driving $310.56B Industry by 2030
Digital ordering, automation, and sustainability fuel QSR growth through 2030.
Executive Summary
The Quick Service Restaurants (QSR) market, within Foodservice and Restaurant Operations under the Consumer Discretionary sector, is valued at $262.75 billion in 2025 and projected to reach $310.56 billion by 2030, representing a compound annual growth rate (CAGR) of 3.4% over the forecast period.
Key Growth Drivers:
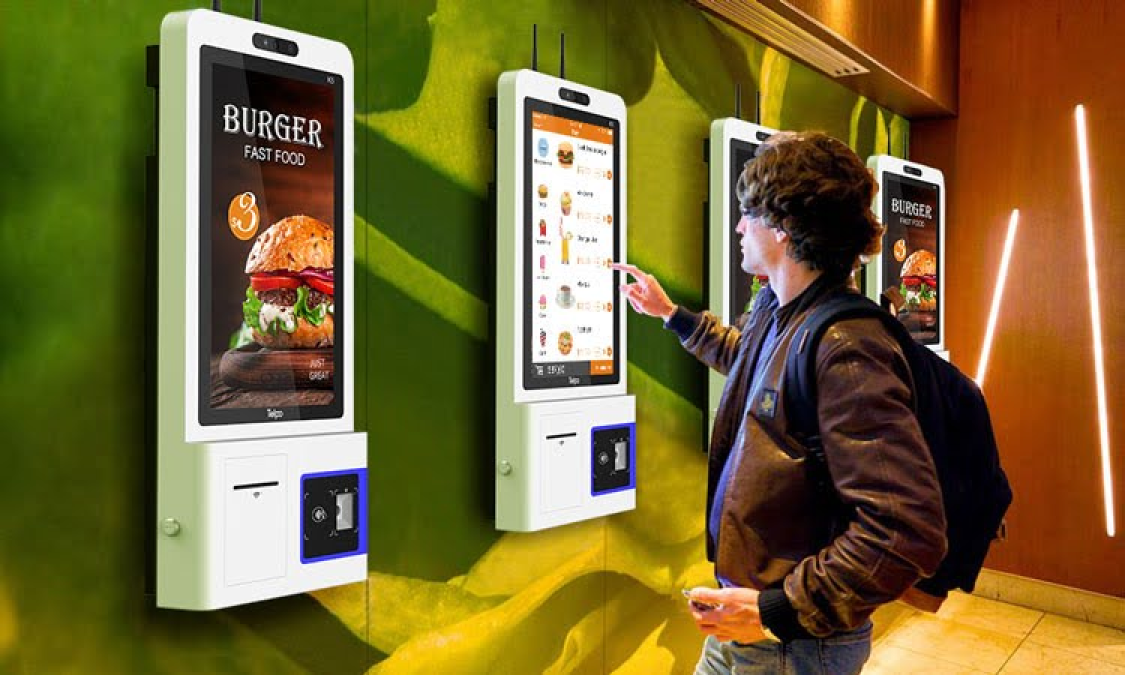
- Continued expansion of digital ordering channels and third-party or home-delivery platforms
- Sustained consumer demand for convenience and value, supported by increased out-of-home dining frequency
- Ongoing menu innovation featuring health-conscious offerings and sustainability initiatives that broaden brand appeal
Outlook:
Positive. The QSR sector is expected to maintain steady, mid-single-digit growth supported by durable structural tailwinds. However, margin pressures from labor costs, commodity inflation, and competitive intensity may temper profitability in the near term.
3.4%
CAGR (2025–2030)
$262.75 billion
Current Market Size (2025)
$310.56 billion
Projected Market Size (2030)
M&A and Investment Activity
Tropical Smoothie Cafe
Blackstone
2024
Blackstone framed Tropical Smoothie as a nationally recognized, high-growth franchisor and positioned the acquisition as a way to accelerate the chain's expansion and support franchise growth. The deal aligns with Blackstone's playbook of scaling franchisors by deploying capital and operating resources to broaden footprint and innovation.
Jersey Mike's Subs (majority stake)
Blackstone
2024
Reports indicate Blackstone will acquire a majority stake while the founder/CEO retains equity, signaling a partnership to accelerate domestic and international unit growth. The deal structure, including earn-out elements tied to store count, underscores a growth-linked value creation strategy leveraging Blackstone's franchise scaling expertise.
Chuy's Holdings, Inc.
Darden Restaurants
2024
Darden stated the acquisition complements its portfolio of full-service and casual brands and expects pre-tax net synergies of approximately $15 million, indicating portfolio diversification and cost/operational synergies. Darden also indicated the transaction would be accretive over the medium term while preserving Chuy's distinct brand identity.
Burger King China (stakes from local franchisee)
Restaurant Brands International
2025
Restaurant Brands International purchased stakes from a local franchisee to achieve near full control of Burger King China, enabling more direct execution of expansion and branding strategies in a key international market. Increased ownership allows RBI to better govern franchise operations and capture more of systemwide economics as it pursues accelerated local growth.
Typical Business Models
1. Franchise-Heavy (Asset-Light)
Pros: Low capital expenditure, strong cash conversion, predictable royalty streams, and attractive returns on invested capital (ROIC).
Cons: Reduced direct control over unit-level execution and brand consistency.
Implication: Higher corporate margins and minimal capex as a percentage of revenue.
2. Company-Owned
Pros: Full operational control and the ability to capture complete unit-level economics.
Cons: Higher capital intensity, balance-sheet exposure, and greater earnings volatility.
Implication: Lower corporate EBITDA due to depreciation and capex, but potential for higher restaurant-level EBITDA if operations are efficient.
3. Hybrid Models
Combine company-owned and franchised units to balance growth and capital needs.
Pros: Diversified cash flows and flexibility in expansion strategy.
Cons: Added reporting complexity and valuation ambiguity relative to pure-play peers.
4. Delivery-First or Virtual Kitchens
Focus on off-premise dining with limited physical footprint.
Pros: Reduced real-estate and buildout costs, faster scalability, and data-driven adaptability.
Cons: Higher channel and marketing expenses, as well as margin pressure from third-party delivery commissions.


Typical Margin Profile
Gross Margin: Generally ranges from approximately 60-75%, with cost of goods sold (COGS) or food costs typically representing 25-40% of revenue. Menus featuring a higher share of beverage and packaged items tend to support stronger margins, while fresh-protein-heavy offerings can compress gross margin performance.
EBITDA Margin: On a consolidated or company-reported basis, public QSR operators typically achieve 6-15% EBITDA margins. At the restaurant (unit) level, efficient locations commonly deliver 18-30% EBITDA margins, depending on scale and operational discipline.
Key Variance Drivers:
- Menu mix and portion control
- Commodity cost volatility and procurement efficiency
- Pricing power and competitive positioning
- Franchisor versus company-owned unit mix
- Off-premise and delivery share, including third-party commission exposure
- Scale benefits, labor productivity, and digital or drive-thru penetration
- Promotional intensity and brand-level discounting strategies
Investor Appetite
Level: Medium to High
Rationale: Investor interest remains strong for franchisors and asset-light QSR concepts given their predictable recurring royalty streams, strong cash generation, and scalable economics. Company-owned chains attract moderate investor appetite, performing well when growth visibility and operational execution are strong but typically discounted for higher capital intensity, execution risk, and sensitivity to labor and commodity inflation as well as competitive pricing pressure.
Overall, the sector’s appeal is supported by resilient consumer demand, continued digital and drive-thru expansion, and favorable unit economics at scale. However, margin pressures from labor costs, input inflation, and third-party delivery commissions remain key constraints on valuation multiples.
Capex Intensity
Level: Medium overall, varying by business model
Indicative Range: Capex typically represents approximately 1 to 3% of revenue for franchisors and other asset-light operators, while company-owned or expansion-focused concepts often spend 3 to 8% or more during active development or remodel cycles.
Major Capex Categories:
- New store openings and remodels, including leasehold improvements
- Kitchen equipment, refrigeration, and HVAC systems
- Drive-thru infrastructure and point-of-sale integrations
- Digital ordering systems such as kiosks and mobile applications
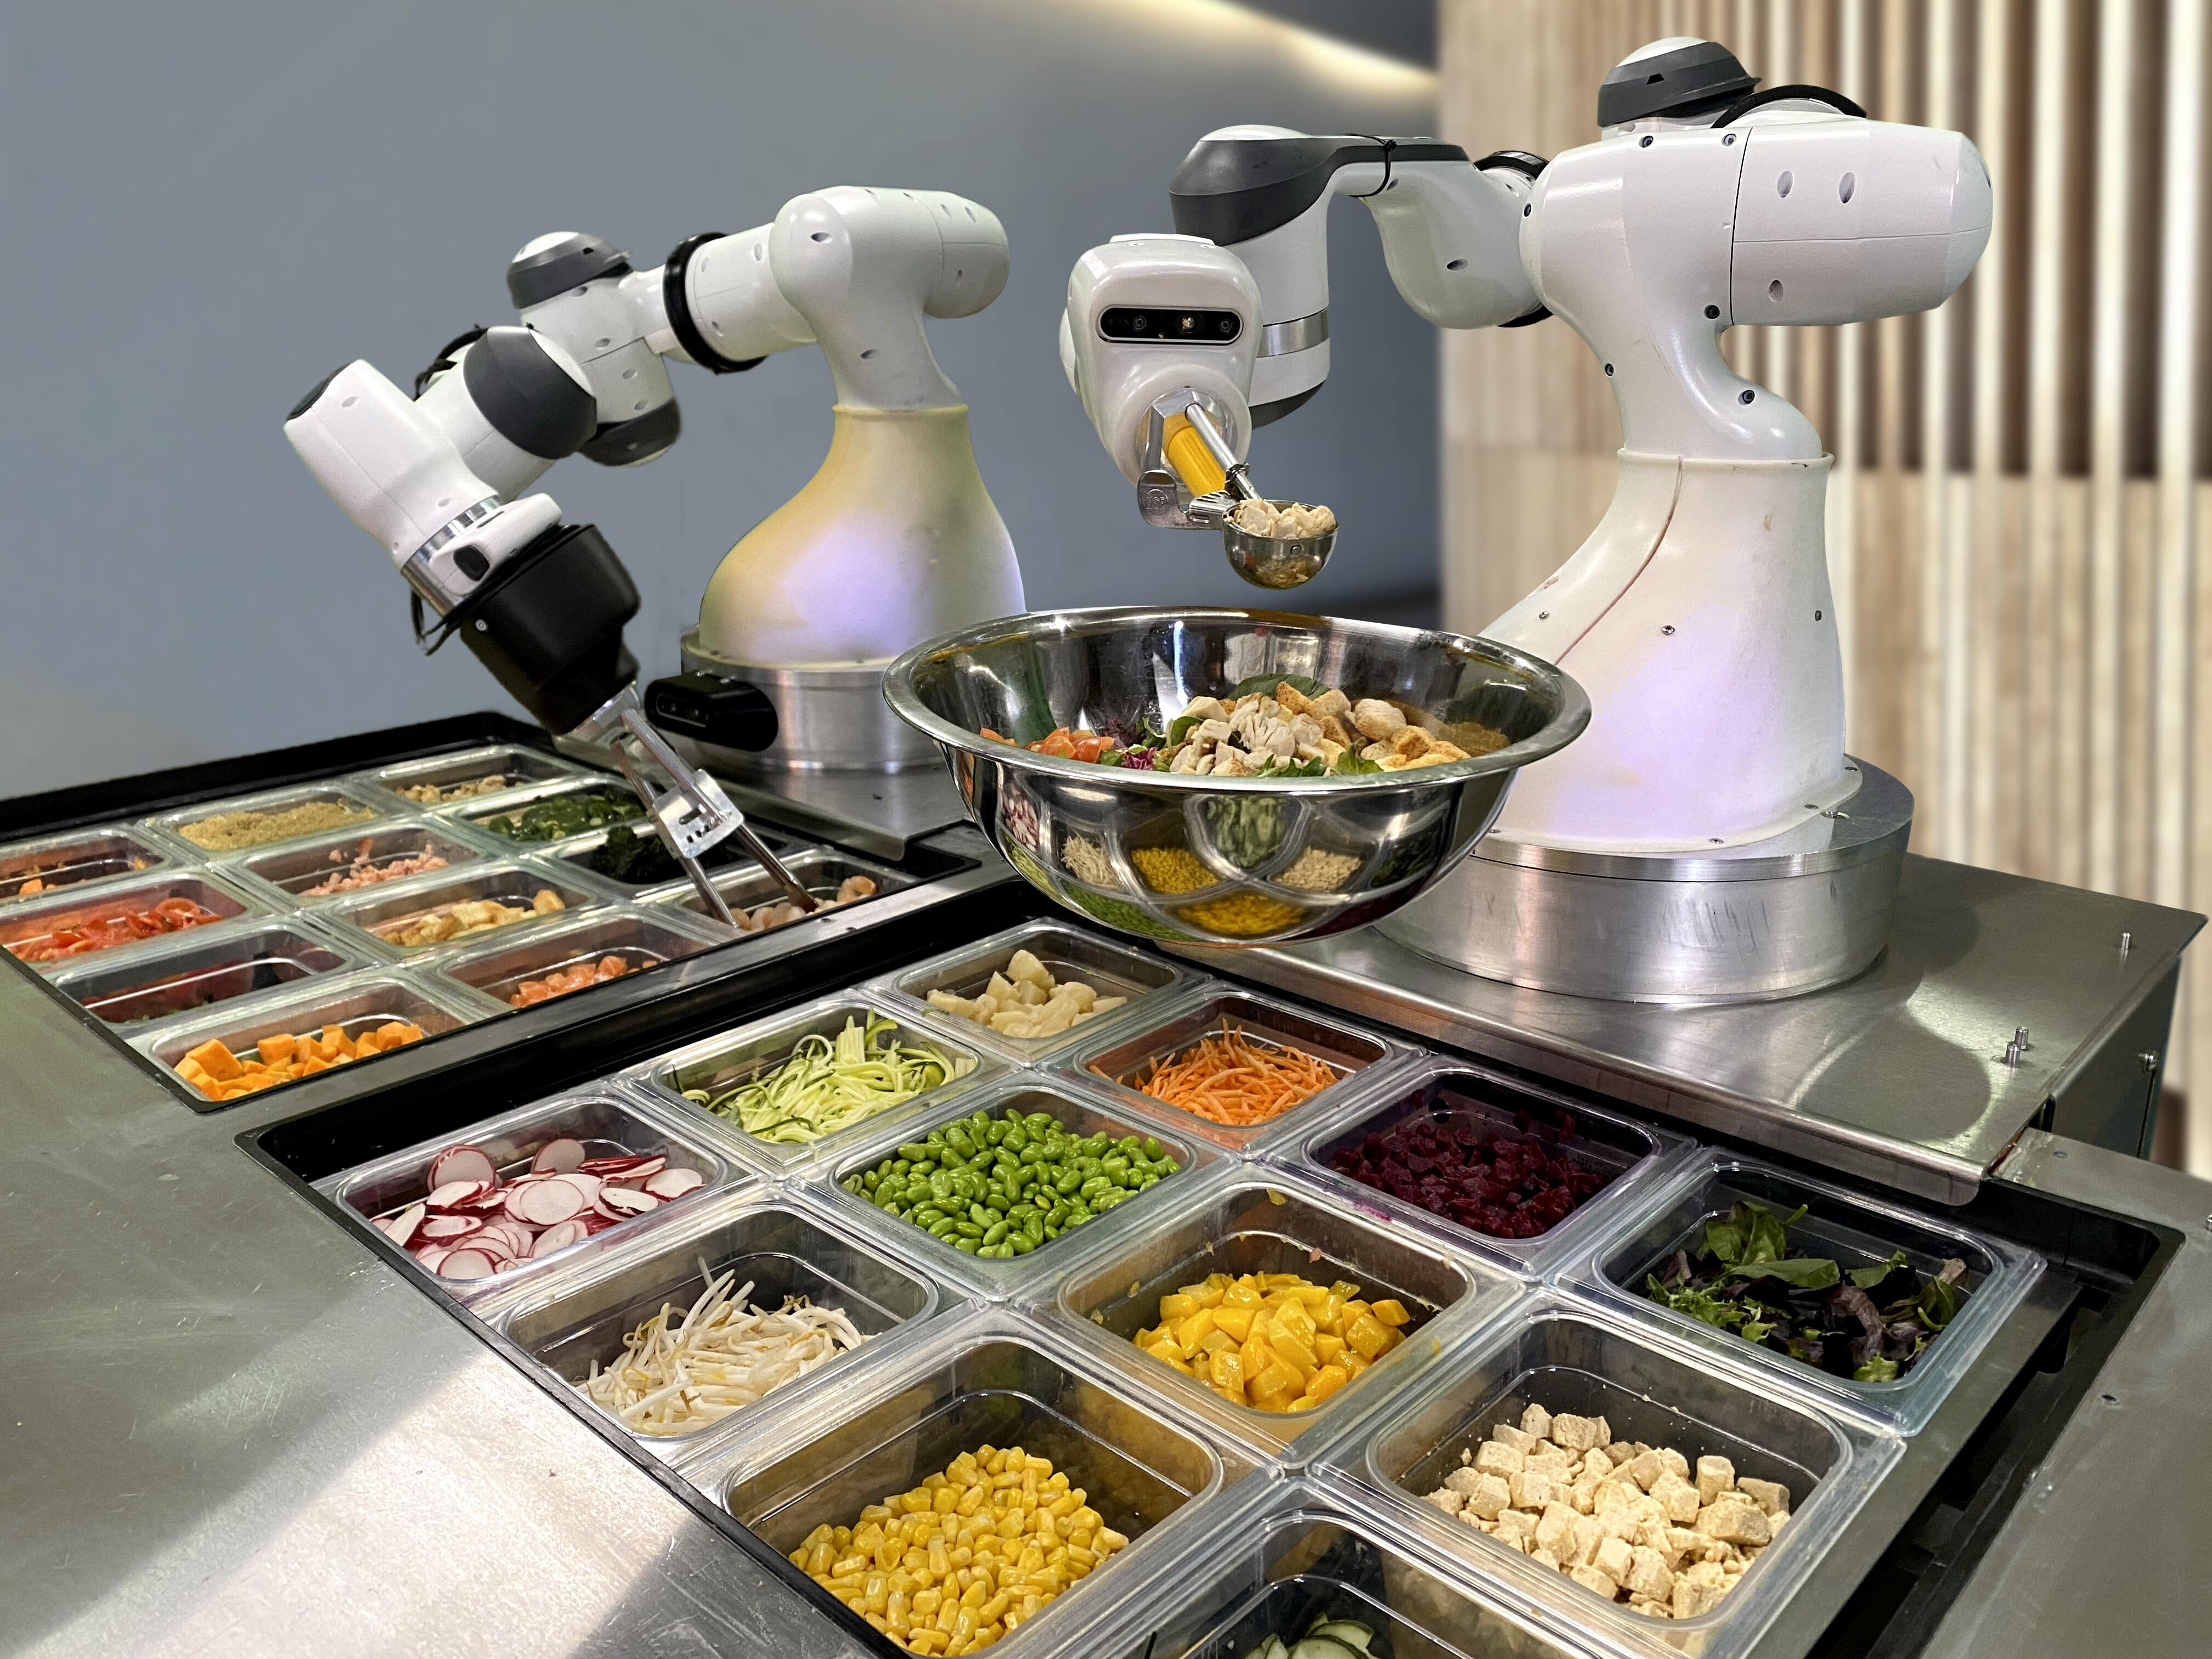
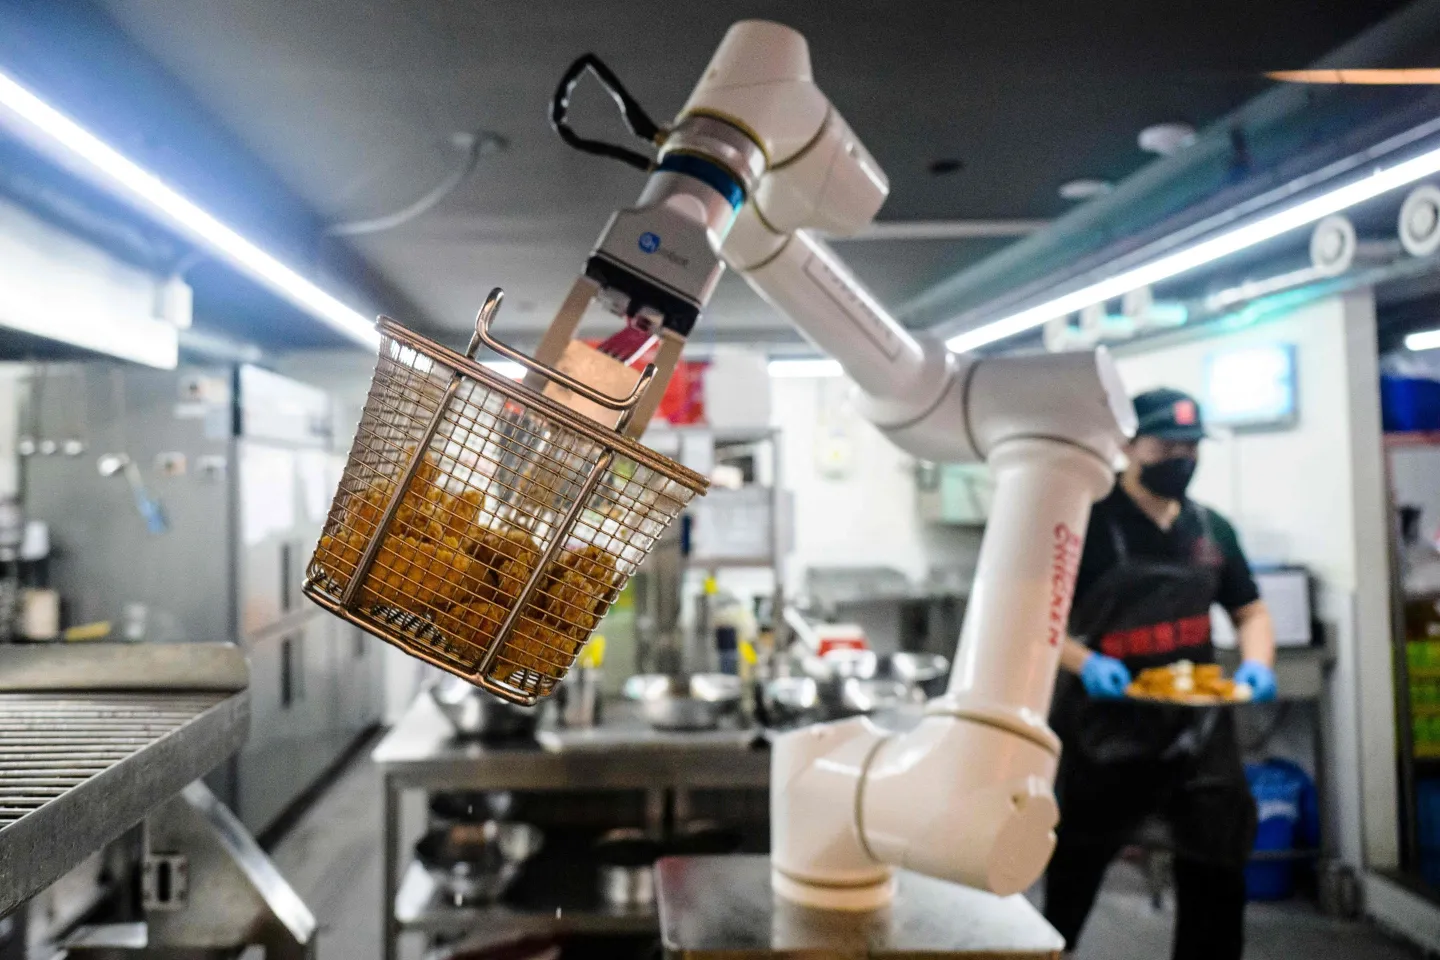
- Back-of-house automation and workflow technology
- Ongoing asset replacement and maintenance investments
Conclusion & Investment Implications
The Quick Service Restaurant (QSR) segment demonstrates strong underlying fundamentals, with projected growth from $262.75 billion in 2025 to $310.56 billion by 2030, representing a compound annual growth rate (CAGR) of 3.4%.
This growth is supported by three key structural tailwinds: the adoption of AI and automation to enhance operational efficiency, the expansion of digital ordering and delivery ecosystems aligned with evolving consumer behavior, and sustainability-focused menu innovation that broadens market appeal.
The industry continues to benefit from consistent consumer demand for convenience and value, though margin pressures from labor costs, input inflation, and competitive intensity remain important factors to monitor. The outlook is further shaped by execution risks as operators integrate new technologies and adapt to shifting customer expectations.
Given the steady growth trajectory, strong digital transformation potential, and ongoing efficiency gains from automation, the QSR segment represents a moderately attractive investment opportunity for investors seeking stable returns within the consumer discretionary space, particularly among companies that can manage cost pressures while leveraging digital and sustainability trends.
Expert Analysis
Subscribe for Exclusive Industry Reports
Thank you! Your submission has been received!
Oops! Something went wrong while submitting the form.