
Waste Management Industry Growth: Regulatory Drivers & Digital Transformation
Environmental regulations and technology drive waste management's profitable market expansion.
Executive Summary
The Environmental Services and Waste Solutions market, within the Industrials – Waste Management segment, is estimated at $377.4 billion in 2025 and projected to reach $488.58 billion by 2030, representing a compound annual growth rate (CAGR) of 5.3% over the 2024–2030 period.
Key Growth Drivers:
- Tightening regulation and expanded producer responsibility (EPR) are increasing demand for waste diversion, treatment, and recycling infrastructure.
- Corporate ESG and circular-economy initiatives are accelerating investment in recycling, recovery, and waste-to-energy solutions, supporting both sustainability goals and cost optimization.
- Digitalization and automation—including smart collection systems, data analytics, and materials tracing—are improving operational efficiency and enabling new service and monetization models.
Outlook:
Positive. Mid-single-digit growth is expected, supported by favorable policy frameworks, technological adoption, and improving commercial economics. While commodity-price volatility and high capital intensity may constrain near-term margin expansion, the sector’s defensive fundamentals and sustainability-driven demand provide a stable long-term growth trajectory.
5.3%
CAGR (2025–2030)
$377.4 billion
Current Market Size (2025)
$488.58 billion
Projected Market Size (2030)
M&A and Investment Activity
Stericycle
Waste Management
2024
Adds a complementary platform in regulated medical waste and secure information destruction, expanding WM's portfolio into higher-growth, higher-margin healthcare waste services. WM cited projected run-rate cost synergies exceeding $125 million and expects to leverage its logistics, technology and disposal network to improve Stericycle's financial profile.
WB Waste Solutions
Waste Management
2025
A tuck-in acquisition that increases WM's commercial and industrial density in the mid-Atlantic/DC region, strengthening local haul and recycling operations and deepening customer relationships. Company materials and industry reporting note the transaction was effective May 1, 2025 and frame it as a regional footprint expansion to improve service density.
Shamrock Environmental
Republic Services
2025
Adds industrial waste and wastewater treatment capabilities to Republic's service set, enabling the acquirer to broaden environmental and industrial offerings for existing and new industrial customers. The transaction was announced via the seller's advisor (BGL) and positioned as a strategic sale to expand Republic's technical service capabilities.
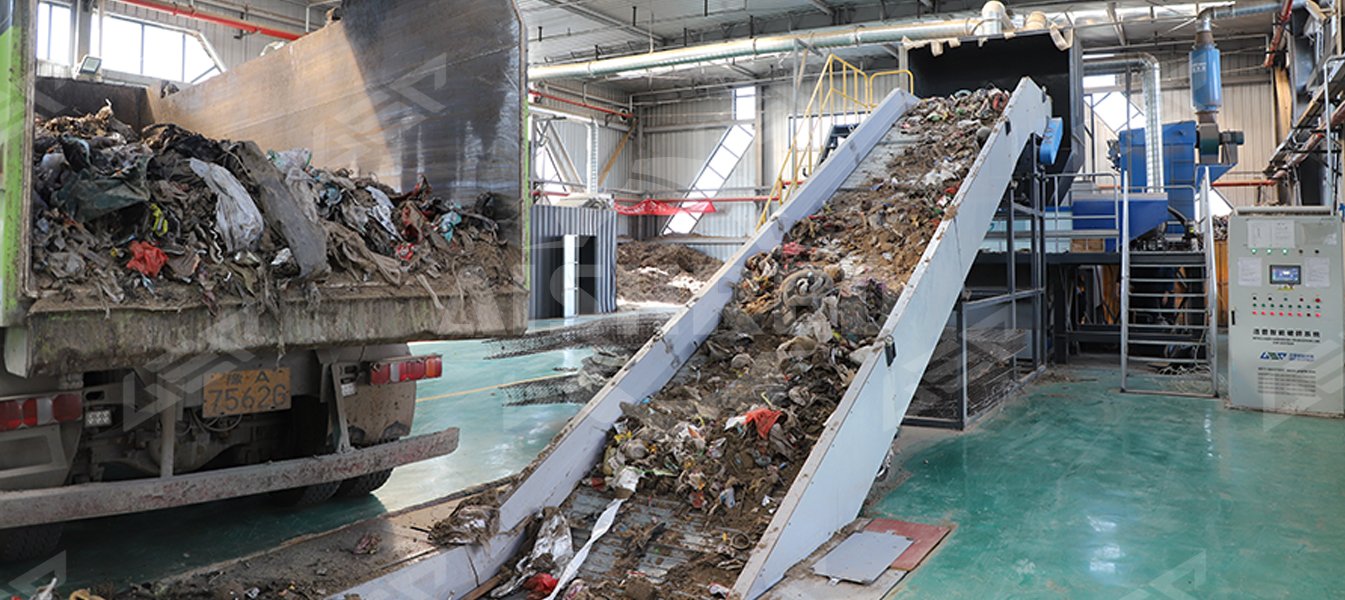
Typical Business Models
1.Municipal / Contract Collection
Description: Provides recurring waste collection services under municipal or long-term contracts.
Pros: Predictable, annuity-like revenue, low churn, and stable cash flows with relatively modest capital intensity (many fleets are leased or contracted).
Cons: Lower margins and limited scalability without new contract wins or pricing resets.
Margin and Capex Implications: Stable margins with low-to-moderate capex; strong cash conversion but constrained margin upside.
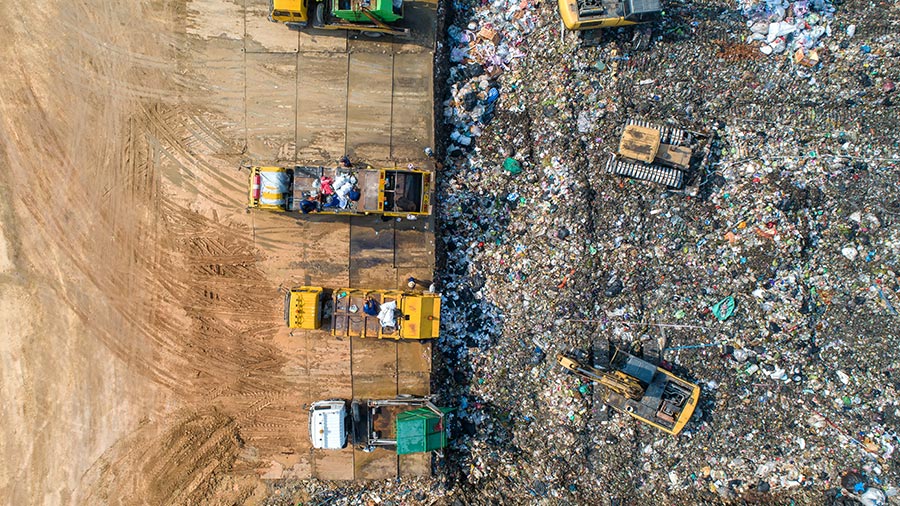
2. Integrated Owner-Operator (Collection + Disposal / Landfill Ownership)
Description: Vertically integrated model combining collection, transfer, and landfill disposal, capturing value throughout the waste management chain.
Pros: Higher margins and free cash flow generation from ownership of disposal assets and long-term landfill cash flows; enhanced pricing leverage and inorganic growth potential.
Cons: High capital intensity, asset and environmental liability risk, and ongoing maintenance obligations.
Margin and Capex Implications: High-margin, high-capex model with durable returns supported by disposal economics.
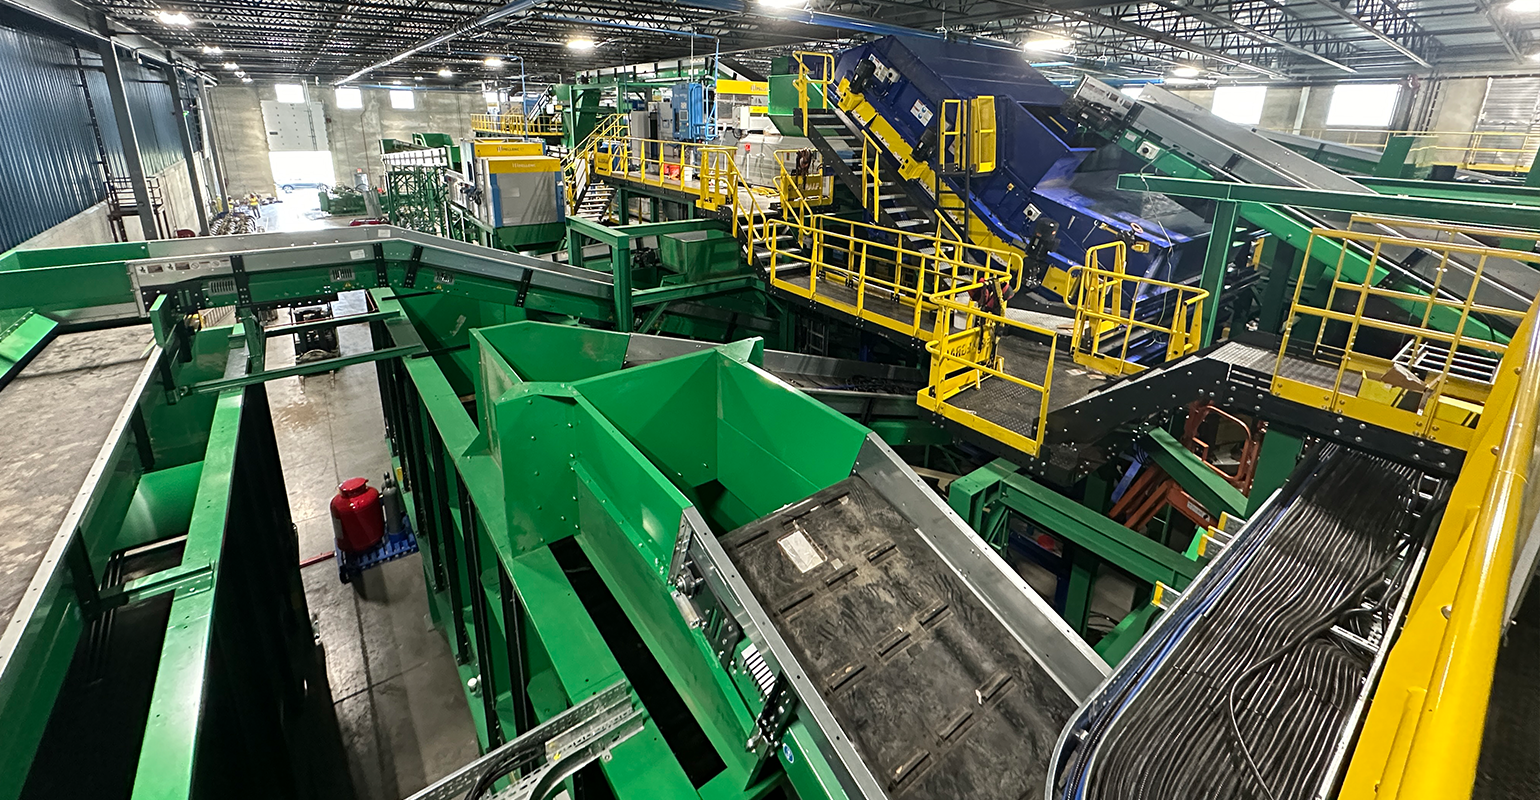
3. Recycling Processing & Commodity Brokerage
Description: Engages in recyclables processing (MRFs) and/or commodity brokerage for recovered materials.
Pros: Brokerage models are asset-light with low capex; potential upside during commodity price peaks.
Cons: High margin volatility tied to commodity markets; MRF operators face moderate capex and operational risk related to throughput and material mix.
Margin and Capex Implications: Variable margins; brokerage = low margin/low capex, MRF = moderate margin/moderate capex.
4. Hazardous / Specialty Environmental Services
Description: Provides technical waste handling, treatment, and remediation services for industrial and hazardous materials.
Pros: High-margin, specialized services with differentiated pricing and strong barriers to entry.
Cons: Complex compliance requirements, regulatory risk, and longer sales cycles.
Margin and Capex Implications: High-margin, specialized capex model with disciplined growth potential and strong cash generation once scaled.
Overall Dynamics:
Scale, contract length and indexation, and asset ownership materially shape margin and capex profiles across models. Integrated operators and specialty providers deliver higher margins but require greater capital commitment, while collection and brokerage models offer stable, lower-capex returns with limited upside potential.


Typical Margin Profile
EBITDA / Operating Margin:
Adjusted operating EBITDA margins typically range from ~25–32% across large public operators. Leading integrated collection and disposal businesses often achieve mid-to-high 30s (for example, WM’s Collection & Disposal segment reports ~37.9%). These margins reflect the benefits of route density, asset ownership, and operational leverage in vertically integrated models.
Gross Margin:
Industry gross margins generally range from ~34–37%, with a broader observed band of ~30–42% depending on service mix, scale, and geographic exposure.
Net Margin:
Typically falls in the low-to-mid single digits up to low double digits, influenced by non-operating factors such as depreciation, amortization, and financing costs.
Key Variance Drivers:
- Scale and route density: Larger operators achieve lower per-stop costs and greater efficiency.
- Asset ownership: Landfill and disposal owners capture higher long-term margins and cash flow.
- Service mix: Hazardous waste, industrial, and specialty treatment services yield higher profitability.
- Pricing power and contract structure: CPI-indexed or annually adjusted contracts stabilize returns.
- Utilization of disposal assets: Higher throughput improves fixed-cost absorption.
- Fuel and labor costs: Volatility impacts operating margins, partially offset by surcharges or pricing mechanisms.
- Recycling commodity prices: Fluctuations in recovered-material pricing affect short-term earnings.
Investor Appetite
Level: Medium
Rationale: The Environmental Services and Waste Solutions sector is valued by investors for its recurring revenue base, predictable cash flows, and strong free cash flow generation at scale. Ongoing industry consolidation and M&A activity further enhance strategic appeal, particularly for investors seeking stable, asset-backed returns with defensive characteristics.
However, investor appetite is moderated by several structural factors, including medium capital intensity, regulatory and environmental liability risks, commodity-price volatility in recycling operations, and limited organic growth levers in mature markets. As a result, while valuation multiples and buyer interest remain solid among strategic and institutional investors, they are generally below those of higher-growth industrial technology sectors.
Capex Intensity
Level: Medium
Indicative Range: Publicly reported capex-to-revenue ratios for major operators typically fall within ~8–12%, with leading waste-management companies such as WM reporting around ~11%.
Major Capex Categories:
- Fleet replacement and expansion (garbage trucks, collection vehicles, and specialized transport)
- Landfill cell construction and environmental-control systems (leachate management, gas capture, and liner installations)
- MRF/recycling plant equipment and modernization projects
- Transfer stations and transfer infrastructure improvements
- IT systems, including route optimization, ERP, and operational automation platforms
- Remediation and specialty treatment facilities for hazardous or regulated waste
- Environmental compliance upgrades and capacity expansions aligned with regulatory mandates
Variability Drivers:
Capex intensity depends on the degree of asset ownership (owner-operators incur higher recurring spend), growth capex tied to geographic expansion or acquisitions, and regulatory-driven remediation or infrastructure upgrade projects.
Conclusion & Investment Implications
The Waste Management sector within Industrials demonstrates robust fundamentals, with projected market expansion from $377.4 billion in 2025 to $488.58 billion by 2030, representing a compound annual growth rate (CAGR) of 5.3%.
Three key drivers underpin this steady growth trajectory: intensifying regulatory frameworks and extended producer responsibility (EPR) mandates; accelerating circular-economy initiatives that transform waste into valuable feedstocks through advanced recycling and waste-to-energy technologies; and rising operational efficiencies enabled by digitalization, automation, and data analytics.
While the industry faces near-term challenges from commodity price volatility and high capital expenditure requirements, the long-term outlook remains decisively positive. The sector benefits from structural tailwinds tied to regulatory compliance, corporate ESG commitments, and technological innovation, all of which support sustainable growth and ongoing investment.
For investors, the Waste Management sector offers defensive characteristics, predictable revenue streams, and exposure to environmental megatrends. Its essential-service nature, coupled with increasing sophistication in recovery, recycling, and energy-conversion technologies, positions the industry for consistent returns, strategic expansion, and long-term value creation.
Expert Analysis
Subscribe for Exclusive Industry Reports
Thank you! Your submission has been received!
Oops! Something went wrong while submitting the form.